Hi,
I am simulating LauncherHetNet.m
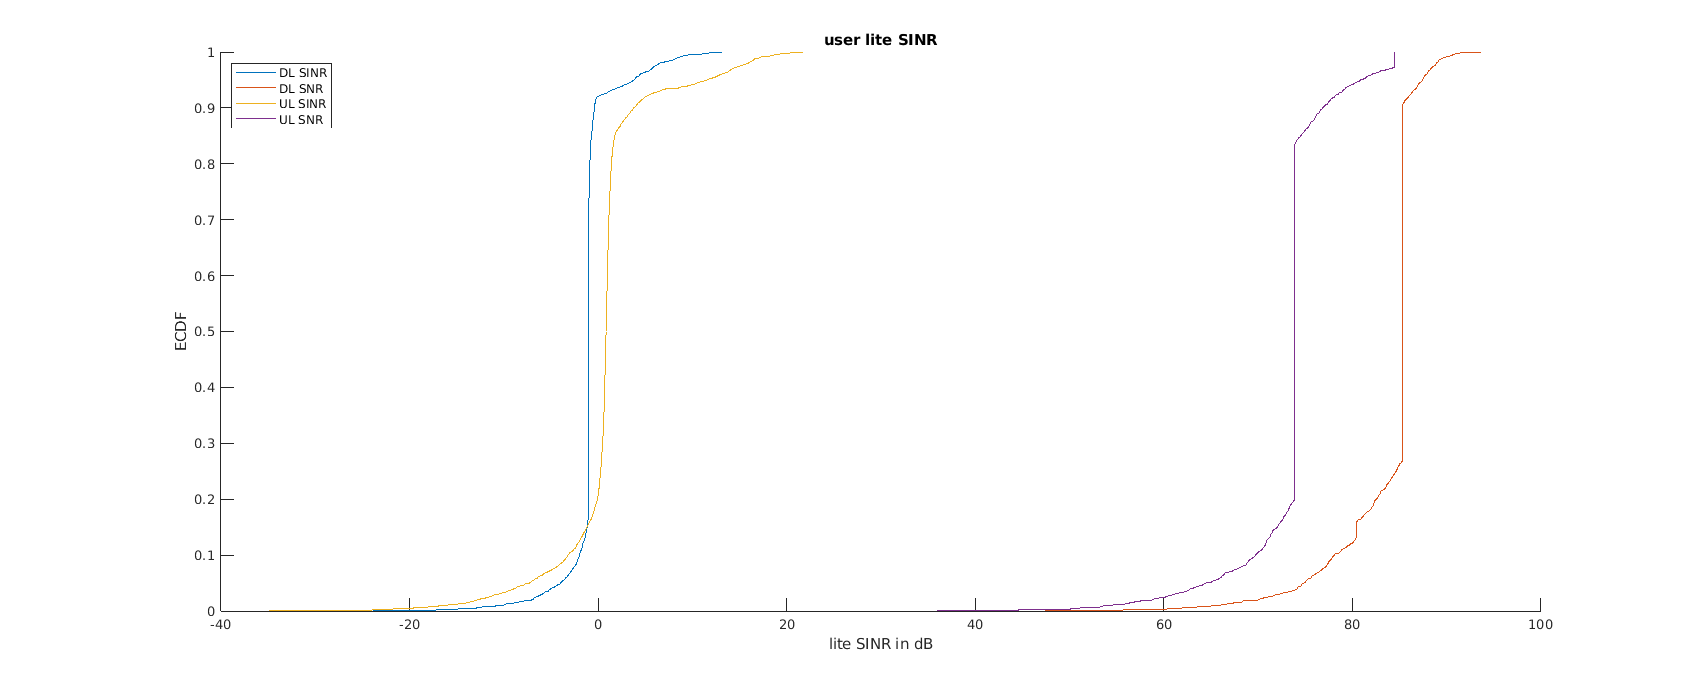
The results of Figure 1 shows ECDF for DLFeedback and DLbestCQI, can you explain a bit, moreover for figure 2 what does DL SINR and DL SNR corresponds to?
For Figure 3 User BLER is calculated, what is user Nr at the X-axis represents? Why Average BLER is 1 from 100 to 126 and from 150 to 183?
Hi Farhan,
Figure 1 gives (a) the performance when using the CQI values reported by the feedback and (b) the maximum performance when using the highest possible CQI. I’m not sure what you meant by your second question, but the figure gives you the resulting SNR and SINR values for both the uplink (UL) and downlink (DL) transmissions. The shift in the curves is due to the interference in the case of SINR. Lastly, Nr is the user number.
Regards,
Charmae
Thanks Charmae, can you please answer this as well?
The user number in the x-axis is the index of each user in an array of all users. You can see which user indices correspond to which user group by checking for example result.params.userParameters(‘poissonUserCar’) for the car users placed through a Poisson point process. You will then see that the users with high BLERs are the vehicular/car users. You can play around with the parameters to see which ones negatively affect the performance of these users.
Hi Charmae,
Reference fig 3, can you elaborate a bit more, as it’s still ambiguous.
Hi Charmae,
As you said
The shift in the curves is due to the interference in the case of SINR
can you elaborate how interference is effecting SINR?
Hi Farhan,
I meant that there is interference in the case of the SINR plots, and this degrades performance. That explains the performance gap between the SNR and SINR plots.
Regards,
Charmae
Hi Charmae,
What research significance this Hetnet Scenario has in your opinion.
Hello Farhan,
the example scenarios are scenarios to show the capabilities of the simulator, how to use it, and how to set the parameters. They do not have a research significance.
Regards,
Agnes